The Frontal Control of Stopping.

Jha A
Nachev P
Barnes G
Husain M
Brown P
Litvak V

The ability to stop or change a voluntary movement is a critical aspect of brain function. Here, we define some of the underlying brain circuits in healthy human subjects, and demonstrate how nerve-cell activity in this circuit changes over time and with behaviour.

Scientific Abstract

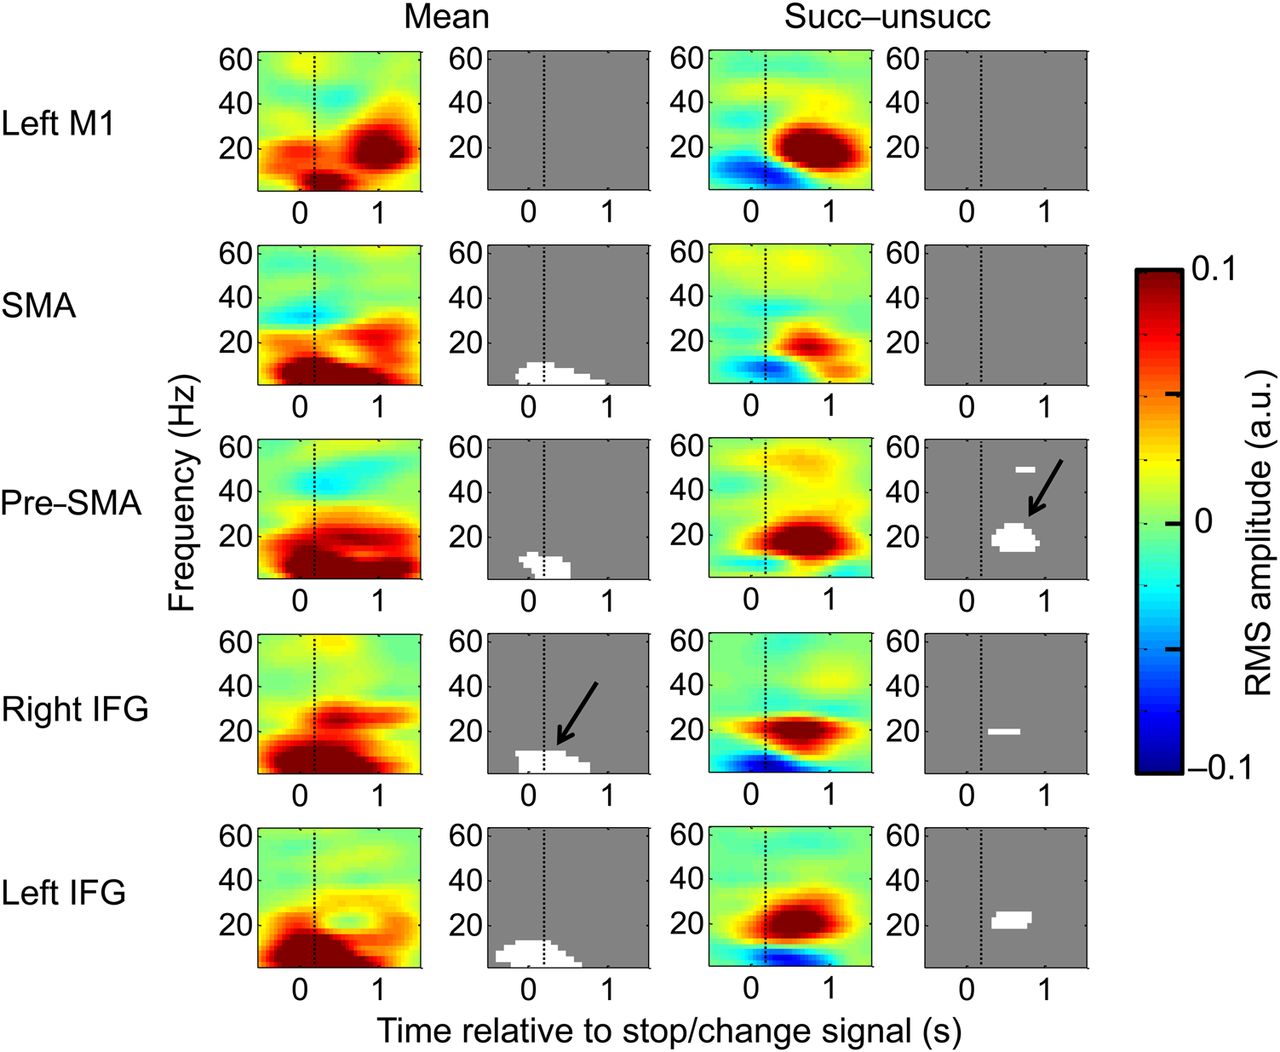
Stopping is a critical aspect of brain function. Like other voluntary actions, it is defined by its context as much as by its execution. Its neural substrate must therefore reflect both. Here, we distinguish those elements of the underlying brain circuit that preferentially reflect contextual aspects of stopping from those related to its execution. Contextual complexity of stopping was modulated using a novel "Stop/Change-signal" task, which also allowed us to parameterize the duration of the stopping process. Human magnetoencephalographic activity and behavioral responses were simultaneously recorded. Whereas theta/alpha frequency activity in the right inferior frontal gyrus was most closely associated with the duration of the stopping process, earlier gamma frequency activity in the pre-supplementary motor area was unique in showing contextual modulation. These results differentiate the roles of 2 key frontal regions involved in stopping, a crucial aspect of behavioral control.

The Frontal Control of Stopping.
Time-frequency plots of magnetoencephalographic activity triggered by a signal to Stop or Change a voluntary action. Each small image displays RMS amplitude changes associated with the Stop/Change-signal as a function of frequency (y-axis, Hz) and peri-stimulus time (x-axis, s, the Stop/Change stimuli occurs at t = 0). Each row contains information from separate cortical areas. Images are in pairs: the colour image is the contrast image, while the grayscale image is a mask identifying significant increases (white) and decreases (black) in amplitude triggered to the Stop/Change-signal. The first column displays the mean induced response to the Stop/Change-signal across all conditions (labelled “Mean”), with the associated statistical maps on the right. The third column displays the difference image between successful and unsuccessful Stop/Change trials (labeled “Succ − unsucc”) and the associated statistical maps on the right. Two major frequency patterns are visible (black arrows): A global increase in theta (1-5 Hz) around the time of Stop/Change-signal presentation, and a later increase in beta (15-30 Hz) in successful Stop/Change conditions restricted to more frontal regions. The colour scale represents amplitude in arbitrary units. M1: primary motor cortex; SMA: supplementary motor area; IFG: is inferior frontal gyrus.
Citation
2015.Cereb. Cortex, 25(11):4392-406.
Related Content
Publication
Abdi A, Mallet N, Mohamed FY, Sharott A, Dodson PD, Nakamura KC, Suri S, Avery SV, Larvin JT, Garas FN, Garas SN, Vinciati F, Morin S, Bezard E, Baufreton J, Magill PJ
2015. J. Neurosci., 35(17):6667-88.
Publication
Chen CC, Yeh CH, Chan HL, Chang YJ, Tu PH, Yeh CH, Lu CS, Fischer P, Tinkhauser G, Tan H, Brown P
2019. Neurobiol. Dis., 132:104605.
Publication
Garas FN, Shah RS, Kormann E, Doig NM, Vinciati F, Nakamura KC, Dorst MC, Smith Y, Magill PJ, Sharott A
2016. eLife, 5:e16088.
Publication
Tinkhauser G, Torrecillos F, Duclos Y, Tan H, Pogosyan A, Fischer P, Carron R, Welter ML, Karachi C, Vandenberghe W, Nuttin B, Witjas T, Régis J, Azulay JP, Eusebio A, Brown P
2018. Neurobiol. Dis., 117(Sept):217-225.
Publication
Dodson PD, Larvin JT, Duffell JM, Garas FN, Doig NM, Kessaris N, Duguid IC, Bogacz R, Butt SJ, Magill PJ
2015. Neuron, 86(2):501-13.